

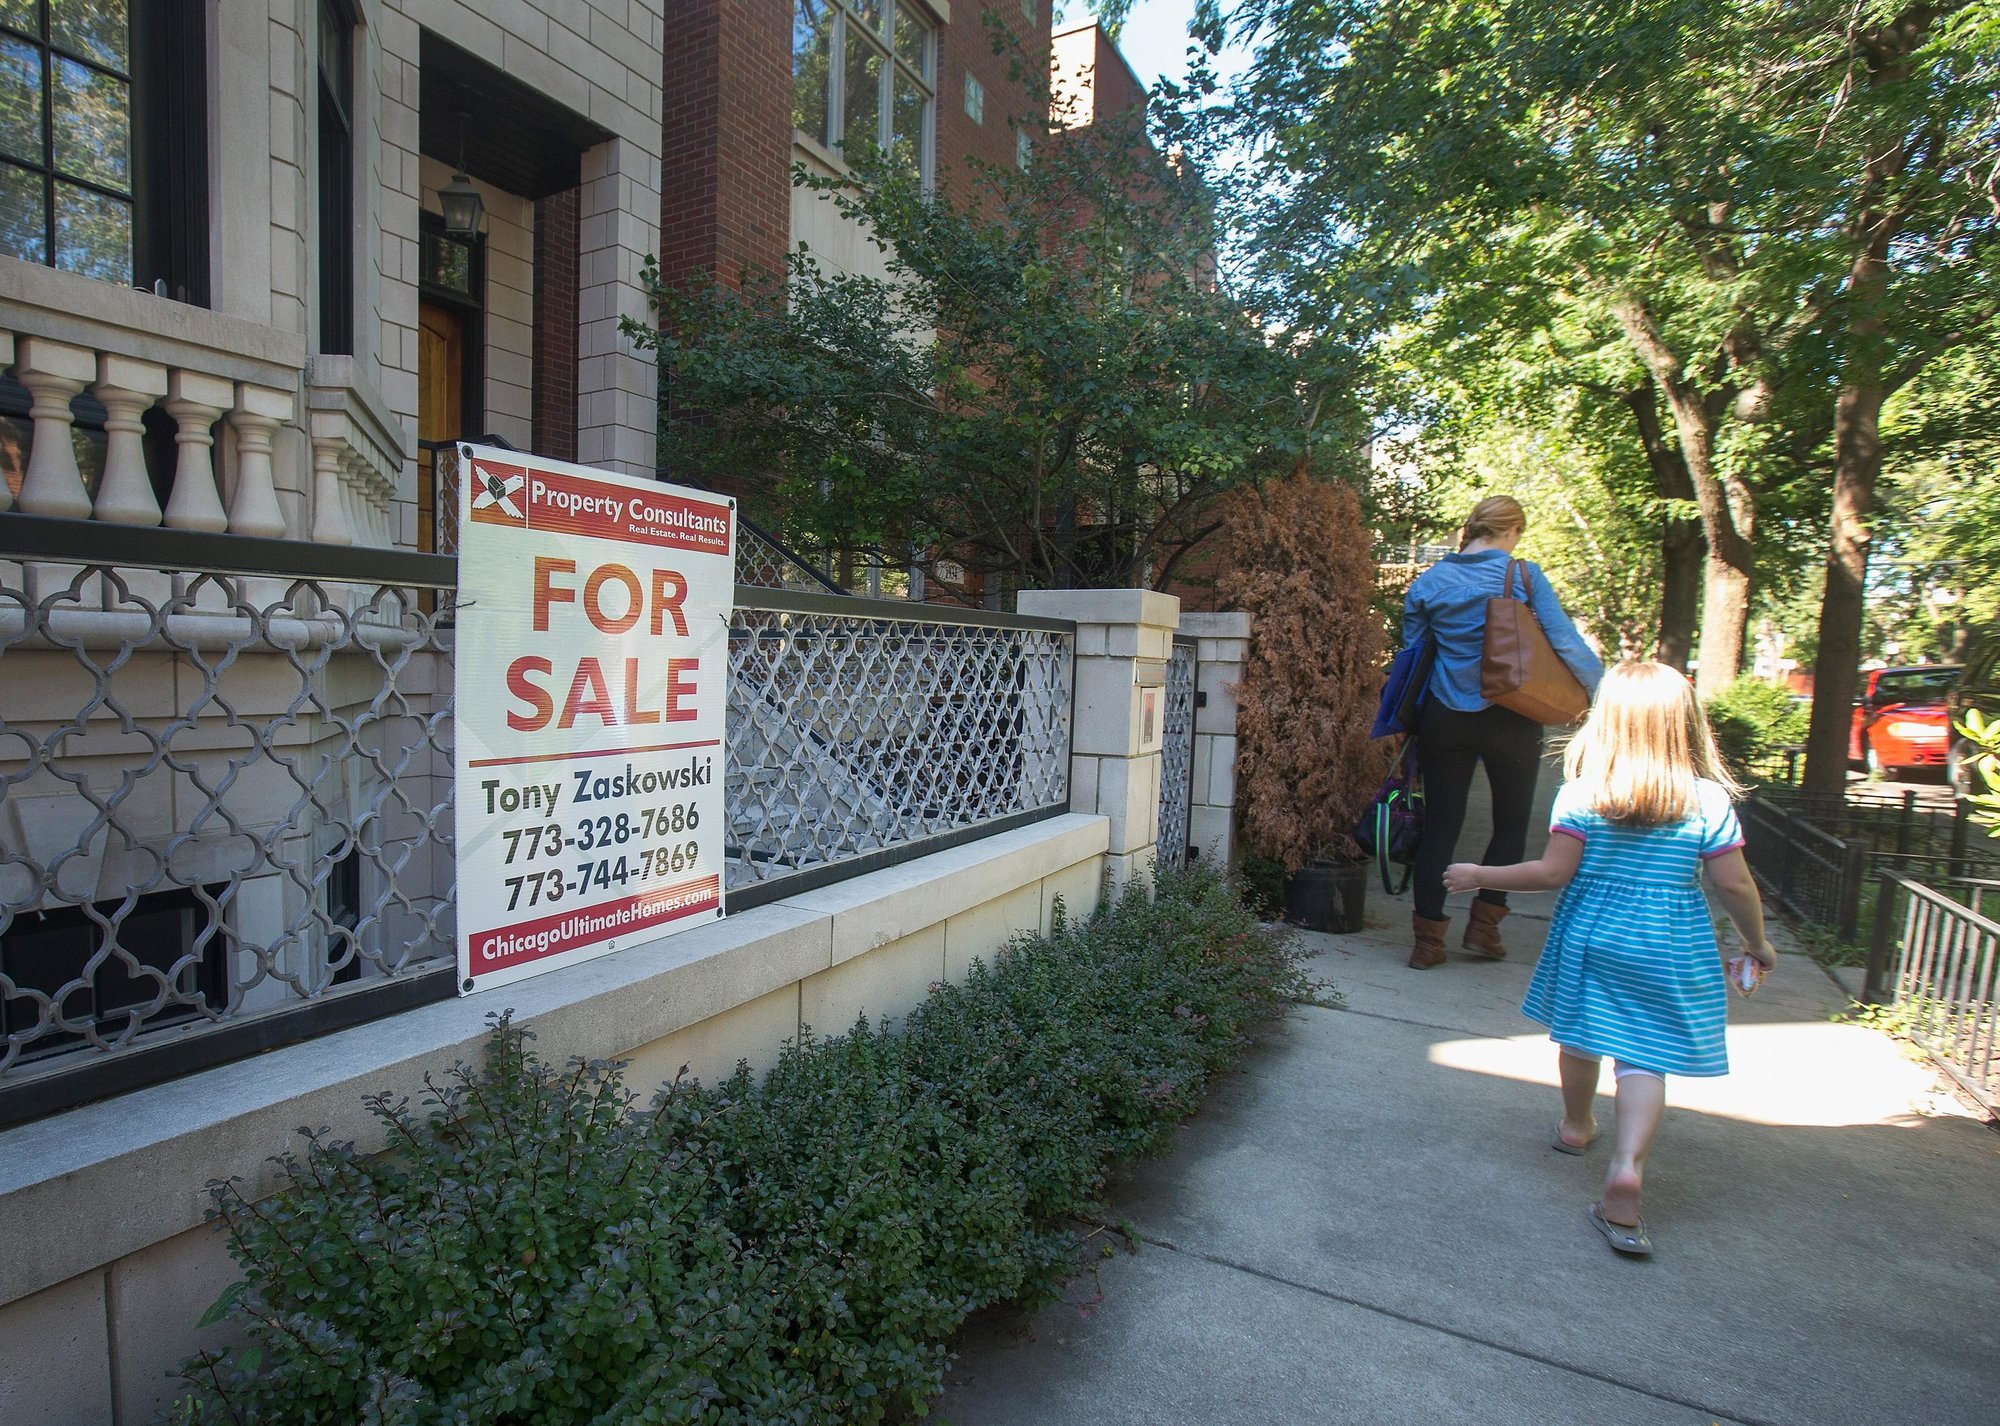
The housing market tends to take more twists and turns than a rural mountain road—and for good reason. A slight change to any economic or social factor can have a massive impact on the market. Take a look at how the ongoing global pandemic has affected the national housing markets—or how any recent recession or period of growth has impacted the market—to find proof.
As the housing market shifts and changes from outside factors, so do the rates of homeownership in the United States. But while global strife, wars, or recessions can have a big impact on homeownership rates, these events may not have the types of impacts you’d expect. In fact, the types of events that you’d expect to cause homeownership rates to plummet or rise may have the exact opposite effects.
Take, for example, how the years from 2004 to 2006 had some of the highest rates of homeownership across the board. These high rates of homeownership occurred just a few years after a recession that was caused by the Sept. 11, 2001, terrorist attack on New York City. In theory, the recession and the attacks should have caused homeownership rates to plummet due to low consumer confidence—but the polar opposite occurred.
On the other hand, the years 2015 through 2017 had some of the lowest rates of homeownership, despite the fact the economy was thriving and unemployment rates were extremely low. It would make sense a thriving economy would lead to high rates of homeownership, but that’s not what happened during that time.
So what exactly drives the constant fluctuations in homeownership rates across the nation? And what events have occurred over the past 25 years to change homeownership rates? Better Mortgage, an online lender and homeownership platform with a free mortgage calculator, analyzed the U.S. Census Bureau’s Housing Vacancies and Homeownership data to determine how homeownership rates have changed over the past 25 years.
This data includes information on homeownership rates for the entire United States, as well as breakdown by region—Northeast, Midwest, South, and West, age, and fiscal quarter with the most recent data covering the third quarter of 2021.
1997
- Homeownership rate (Q3): 66% (#10 lowest over past 25 years)
- Change from previous year: +0.4%
Regional breakdown:
- Northeast: 63% (#9 lowest over past 25 years)
- Midwest: 70.7% (#10 lowest)
- South: 68.2% (#10 lowest)
- West: 59.8% (#6 lowest)
Age breakdown:
- Under 35 years: 38.9% (#11 lowest over past 25 years)
- 35 to 44 years: 66.5% (#12 highest)
- 45 to 54 years: 76.3% (#8 highest)
- 55 to 64 years: 80.1% (#10 highest)
- 65 years and over: 79.2% (#6 lowest)
Overall homeownership rates were significantly lower than normal in 1997—and this trend was due in large part to the 1997 Asian economic crisis, which caused complete financial collapse for certain areas of Asia. This massive economic event caused global concern over the potential for a worldwide economic meltdown due to financial contagion. It also directly affected American markets, which took a severe financial hit in late 1997 when the Dow Jones Industrial Average plunged 554 points over fears of how the Asian crisis would affect the U.S. economy. This led to a significant drop in consumer confidence and spending—and caused homeownership rates to decline in turn.
1998
- Homeownership rate (Q3): 66.8% (#12 lowest over past 25 years)
- Change from previous year: +0.8%
Regional breakdown:
- Northeast: 63.4% (#10 lowest over past 25 years)
- Midwest: 71.7% (#11 highest)
- South: 68.8% (#12 lowest)
- West: 61.1% (#13 lowest)
Age breakdown:
- Under 35 years: 39.5% (#13 lowest over past 25 years)
- 35 to 44 years: 67.8% (#9 highest)
- 45 to 54 years: 76.3% (#8 highest)
- 55 to 64 years: 81.1% (#4 highest)
- 65 years and over: 79.7% (#8 lowest)
Homeownership rates continued their descent into 1998, and it was due in large part to the aftereffects of the Asian economic crisis. While the Asian economic crisis had a direct impact on the U.S. stock market in 1997, it had caused a full global financial meltdown by the following year. The economies in Russia and Brazil were sent spiraling, and international stock markets hit record lows due to extremely low investor confidence. This widespread economic volatility led to even lower consumer confidence in the United States, which curbed investments in homeownership and caused the overall homeownership rate to plummet year-over-year.
1999
- Homeownership rate (Q3): 67% (#12 highest over past 25 years)
- Change from previous year: +0.2%
Regional breakdown:
- Northeast: 63.6% (#12 lowest over past 25 years)
- Midwest: 72.1% (#8 highest)
- South: 69.3% (#12 highest)
- West: 60.8% (#12 lowest)
Age breakdown:
- Under 35 years: 40.1% (#11 highest over past 25 years)
- 35 to 44 years: 67.4% (#10 highest)
- 45 to 54 years: 76.3% (#8 highest)
- 55 to 64 years: 80.7% (#8 highest)
- 65 years and over: 80.8% (#7 highest)
One year later, the U.S. economy was well on its way to a full recovery—as was the Asian economy after the crisis. This led to the American economy growing at a rate that exceeded 5%—and an unemployment rate that was well below 4% by the end of the year. With low unemployment, a thriving economy, and a median family income of $48,831, Americans were more confident in the economy than they had been in previous years—and the overall homeownership rates reflect that trend. Homeownership rates increased across all age brackets, as higher wages and widespread financial stability meant that more people could afford to purchase homes at this point in time.
DETERMINING YOUR HOMEBUYING BUDGET
When asking yourself “How much house can I afford?” There’s a lot to consider from your credit score down to your monthly miscellaneous expenses. To get a better sense of your budget, check out the Better Mortgage affordability calculator.
2000
- Homeownership rate (Q3): 67.7% (#9 highest over past 25 years)
- Change from previous year: +0.7%
Regional breakdown:
- Northeast: 63.9% (#10 highest over past 25 years)
- Midwest: 72.9% (#5 highest)
- South: 69.7% (#9 highest)
- West: 62.2% (#10 highest)
Age breakdown:
- Under 35 years: 41.1% (#8 highest over past 25 years)
- 35 to 44 years: 68.4% (#7 highest)
- 45 to 54 years: 76.8% (#3 highest)
- 55 to 64 years: 80.1% (#10 highest)
- 65 years and over: 80.7% (#8 highest)
The economy in the United States remained strong through 2000, and it resulted in even higher overall homeownership rates compared to the previous year. A number of factors were contributing to strong economic growth, including favorable borrowing conditions and low unemployment rates. The Nasdaq composite stock market index also hit a peak this year when it rose by 400%—growth that was led by the dot-com boom. In turn, more Americans were able to afford to purchase homes, which led to homeownership rates growing across all regions and age brackets.
2001
- Homeownership rate (Q3): 68.1% (#6 highest over past 25 years)
- Change from previous year: +0.4%
Regional breakdown:
- Northeast: 64.1% (#8 highest over past 25 years)
- Midwest: 72.9% (#5 highest)
- South: 70.1% (#5 highest)
- West: 63.1% (#7 highest)
Age breakdown:
- Under 35 years: 41.6% (#6 highest over past 25 years)
- 35 to 44 years: 68.6% (#3 highest)
- 45 to 54 years: 77.1% (#2 highest)
- 55 to 64 years: 81.6% (#1 highest)
- 65 years and over: 80.3% (#12 lowest)
Homeownership rates had already been growing before 2001, due in large part to easier financing and a strong economy, but the events that occurred on Sept. 11, 2001, helped to propel the homeownership rate higher than before. While it may seem unlikely that a devastating event would be the catalyst for higher rates of homeownership, that is exactly what happened. The attacks in New York City caused the U.S. economy to struggle, which led to the Federal Reserve cutting interest rates to historically low levels in order to stimulate the economy. When interest rates are low, homeownership rates typically increase, as buyers want to take advantage of cheap borrowing. That contributed to high rates of homeownership across all ages and regions in 2001.

2002
- Homeownership rate (Q3): 68% (#7 highest over past 25 years)
- Change from previous year: -0.1%
Regional breakdown:
- Northeast: 64.6% (#4 highest over past 25 years)
- Midwest: 73.2% (#4 highest)
- South: 69.5% (#11 highest)
- West: 62.7% (#8 highest)
Age breakdown:
- Under 35 years: 42.5% (#4 highest over past 25 years)
- 35 to 44 years: 68.8% (#1 highest)
- 45 to 54 years: 76.5% (#5 highest)
- 55 to 64 years: 81.1% (#4 highest)
- 65 years and over: 80.7% (#8 highest)
Easy access to financing, low mortgage rates, and a stimulated economy led homeownership to remain high during 2002. The Fed lowering interest rates after the terrorist attacks had a big—and positive—impact on the economy. Business was literally booming, which led consumer confidence to be high. This, in turn, led to homeownership rates hitting a high point for buyers from 35 to 44—who were able to afford homeownership due to the low interest rates and steady incomes that were readily available during this time.
2003
- Homeownership rate (Q3): 68.4% (#4 highest over past 25 years)
- Change from previous year: +0.4%
Regional breakdown:
- Northeast: 64.4% (#5 highest over past 25 years)
- Midwest: 73.5% (#2 highest)
- South: 70% (#7 highest)
- West: 63.8% (#4 highest)
Age breakdown:
- Under 35 years: 41.5% (#7 highest over past 25 years)
- 35 to 44 years: 68.6% (#3 highest)
- 45 to 54 years: 76.4% (#6 highest)
- 55 to 64 years: 81.3% (#2 highest)
- 65 years and over: 80.4% (#13 lowest)
By 2003, subprime lending—or financing offered to buyers with bad credit or other financial hurdles—was common. Lenders had been struggling to meet the demands by investors for certain types of mortgage-related investments and opted to loosen the lending parameters to increase the rates of mortgages being issued to buyers. This made it a lot easier for under-qualified buyers to purchase homes, but saddled buyers with predatory or questionable loan terms in return. The rampant subprime lending practices helped the rate of homeownership to grow even higher in 2003, but the groundwork was laid for a disaster to occur just a few years later.
2004
- Homeownership rate (Q3): 69% (#1 highest over past 25 years)
- Change from previous year: +0.6%
Regional breakdown:
- Northeast: 64.4% (#5 highest over past 25 years)
- Midwest: 73.8% (#1 highest)
- South: 71% (#1 highest)
- West: 64.7% (#2 highest)
Age breakdown:
- Under 35 years: 43.1% (#1 highest over past 25 years)
- 35 to 44 years: 68.6% (#3 highest)
- 45 to 54 years: 77.4% (#1 highest)
- 55 to 64 years: 81.2% (#3 highest)
- 65 years and over: 81.8% (#1 highest)
Lenders continued to be extremely loose with their lending requirements throughout 2004, despite the warning signs that a housing market collapse could be coming. With ongoing demand for mortgage-related investments, more and more borrowers were approved for loans they could not afford. In 2004, the rate of buyers under 35 hit a high point, and housing prices were skyrocketing. Borrowers were offered higher amounts of money for their home purchases, with many of them otherwise unqualified to borrow the money. This upward trend in homeownership occurred even as the Federal Reserve raised interest rates several times—and as buyers opted for interest-only or other predatory loan types.
2005
- Homeownership rate (Q3): 68.8% (#3 highest over past 25 years)
- Change from previous year: -0.2%
Regional breakdown:
- Northeast: 65.1% (#3 highest over past 25 years)
- Midwest: 73.3% (#3 highest)
- South: 70.6% (#3 highest)
- West: 64.2% (#3 highest)
Age breakdown:
- Under 35 years: 43% (#2 highest over past 25 years)
- 35 to 44 years: 68.6% (#3 highest)
- 45 to 54 years: 76.7% (#4 highest)
- 55 to 64 years: 80.9% (#7 highest)
- 65 years and over: 80.6% (#11 highest)
By 2005, lending parameters were still extremely malleable, but the rate of homeownership dipped slightly compared to 2004. This was likely due, at least in part, to the fact that home prices were skyrocketing—and competition for inventory was stiff. Rates were also hiked several times this year, making it more expensive to purchase homes. Still, subprime mortgages remained a common type of financing, with lenders offering numerous types of unaffordable loans to unqualified buyers. This kept homeownership rates higher than normal in all regions, especially when it came to younger buyers.
2006
- Homeownership rate (Q3): 69% (#1 highest over past 25 years)
- Change from previous year: +0.2%
Regional breakdown:
- Northeast: 65.5% (#1 highest over past 25 years)
- Midwest: 72.8% (#7 highest)
- South: 70.6% (#3 highest)
- West: 65.3% (#1 highest)
Age breakdown:
- Under 35 years: 43% (#2 highest over past 25 years)
- 35 to 44 years: 68.8% (#1 highest)
- 45 to 54 years: 76.4% (#6 highest)
- 55 to 64 years: 80.7% (#8 highest)
- 65 years and over: 81.5% (#2 highest)
In 2006, home prices declined for the first time in years while inventory rose—which led to more buyers hopping on the buying train. The buyers who were unable to compete price-wise in previous years were suddenly able to snatch up deals on homes, but the declining prices were indicative of what was to come. Still, buying remained high, and interest rates, while higher than years past, were still relatively low, too. Most economists thought that the dip in pricing and increase in inventory was only evident of a cooling-off period—not a total collapse—which kept the consumer confidence high.
2007
- Homeownership rate (Q3): 68.2% (#5 highest over past 25 years)
- Change from previous year: -0.8%
Regional breakdown:
- Northeast: 65.2% (#2 highest over past 25 years)
- Midwest: 71.9% (#9 highest)
- South: 70.1% (#5 highest)
- West: 63.5% (#5 highest)
Age breakdown:
- Under 35 years: 42% (#5 highest over past 25 years)
- 35 to 44 years: 68.1% (#8 highest)
- 45 to 54 years: 75.2% (#11 highest)
- 55 to 64 years: 81.1% (#4 highest)
- 65 years and over: 79.9% (#9 lowest)
The housing market started a significant downward trajectory in 2007—due in major part to the subprime mortgage lending practices that prevailed during this time. These risky lending practices saddled homeowners with fluctuating interest rates, balloon payments, and other unaffordable terms, which caused millions of homeowners to be unable to afford their homes. This had a direct impact on homeownership rates, as the once-thriving housing market came to a standstill. By March 2007, the average national home sales and the average national home prices were on the steepest downward plunge to occur since the 1989 Savings and Loan crisis—further dampening consumer confidence.

2008
- Homeownership rate (Q3): 67.9% (#8 highest over past 25 years)
- Change from previous year: -0.3%
Regional breakdown:
- Northeast: 64.4% (#5 highest over past 25 years)
- Midwest: 71.9% (#9 highest)
- South: 69.9% (#8 highest)
- West: 63.5% (#5 highest)
Age breakdown:
- Under 35 years: 41% (#9 highest over past 25 years)
- 35 to 44 years: 67.2% (#11 highest)
- 45 to 54 years: 75.2% (#11 highest)
- 55 to 64 years: 80% (#12 highest)
- 65 years and over: 80.1% (#11 lowest)
The fallout from the housing market bubble burst continued into 2008, with homeownership rates further declining year-over-year. High rates of foreclosures became commonplace as mortgages became unaffordable for those with subprime loans, which contributed to the decline in homeownership from the previous year. Home values plummeted in tandem, which made it difficult for buyers to feel confident in the market and made it tough for homeowners to sell their homes to purchase new ones. In turn, the rate of homeownership further plummeted.
2009
- Homeownership rate (Q3): 67.6% (#10 highest over past 25 years)
- Change from previous year: -0.3%
Regional breakdown:
- Northeast: 64% (#9 highest over past 25 years)
- Midwest: 71.6% (#12 highest)
- South: 69.7% (#9 highest)
- West: 62.7% (#8 highest)
Age breakdown:
- Under 35 years: 39.8% (#12 highest over past 25 years)
- 35 to 44 years: 66.5% (#12 highest)
- 45 to 54 years: 74.5% (#13 lowest)
- 55 to 64 years: 79.4% (#13 lowest)
- 65 years and over: 80.9% (#6 highest)
By 2009, the United States was in a full-blown recession. Known as the Great Recession, the period from 2007 to 2009 was one of the worst times in recent American history, and was also the longest economic downturn to occur since World War II. The unemployment rate was extremely high, peaking at 10% in October 2009, which meant that most Americans couldn’t afford to buy homes. Lenders were also extremely wary of borrowers following the housing bubble burst, so it was hard to finance a home. This contributed to low rates of homeownership—and a number of other housing-related hardships as well.
2010
- Homeownership rate (Q3): 66.9% (#13 lowest over past 25 years)
- Change from previous year: -0.7%
Regional breakdown:
- Northeast: 63.9% (#10 highest over past 25 years)
- Midwest: 71.1% (#12 highest)
- South: 69.1% (#13 lowest)
- West: 61.3% (#12 highest)
Age breakdown:
- Under 35 years: 39.2% (#12 lowest over past 25 years)
- 35 to 44 years: 65.2% (#12 lowest)
- 45 to 54 years: 73% (#12 lowest)
- 55 to 64 years: 79.2% (#12 lowest)
- 65 years and over: 80.6% (#11 highest)
There were hopes that the housing market would begin to recover in 2010, but things only got worse—and homeownership rates continued to decline. Home values stayed extremely low throughout 2010, and prices were down by another 4.1% at year’s end. Unemployment rates were still extremely high, too—making it impossible for many people to afford home purchases, especially given the average interest rates at the time. Plus, banks and lenders were still in terrible shape during this time, making it incredibly difficult to obtain funding for home purchases.

2011
- Homeownership rate (Q3): 66.3% (#11 lowest over past 25 years)
- Change from previous year: -0.6%
Regional breakdown:
- Northeast: 63.7% (#13 lowest over past 25 years)
- Midwest: 70.3% (#9 lowest)
- South: 68.4% (#11 lowest)
- West: 60.7% (#11 lowest)
Age breakdown:
- Under 35 years: 38% (#9 lowest over past 25 years)
- 35 to 44 years: 63.4% (#10 lowest)
- 45 to 54 years: 72.7% (#11 lowest)
- 55 to 64 years: 78.6% (#11 lowest)
- 65 years and over: 81.1% (#5 highest)
The housing market continued to get weaker into 2011, but there were a few positive signs that it may be on the mend. For example, the national housing prices saw a 3.9% annual decline during the third quarter of 2011, but it was still an improvement compared to the quarter prior. Homeownership rates also increased compared to a year prior—but a weak economy, an ongoing foreclosure crisis, and a surplus of new construction kept homeownership rates lower than normal across the board. Higher interest rates also likely played a part in the lower rates of homeownership during this time.

2012
- Homeownership rate (Q3): 65.5% (#9 lowest over past 25 years)
- Change from previous year: -0.8%
Regional breakdown:
- Northeast: 63.9% (#10 highest over past 25 years)
- Midwest: 69.6% (#8 lowest)
- South: 66.9% (#8 lowest)
- West: 60.1% (#8 lowest)
Age breakdown:
- Under 35 years: 36.3% (#5 lowest over past 25 years)
- 35 to 44 years: 61.8% (#9 lowest)
- 45 to 54 years: 72% (#10 lowest)
- 55 to 64 years: 76.9% (#10 lowest)
- 65 years and over: 81.4% (#3 highest)
In early 2012, the housing market crash had hit the bottom, which in this case was a good thing. Hitting the low point allowed the market to begin its rebound—and homeownership rates followed suit. The economy was slowly recovering from the Great Recession, which led to lower rates of unemployment and lower rates of foreclosure. More jobs also meant that more buyers could take advantage of the low home prices, which further pushed the housing market toward the healing stage.
2013
- Homeownership rate (Q3): 65.3% (#7 lowest over past 25 years)
- Change from previous year: -0.2%
Regional breakdown:
- Northeast: 63.6% (#12 lowest over past 25 years)
- Midwest: 69.6% (#8 lowest)
- South: 66.9% (#8 lowest)
- West: 59.5% (#5 lowest)
Age breakdown:
- Under 35 years: 36.8% (#7 lowest over past 25 years)
- 35 to 44 years: 61.1% (#7 lowest)
- 45 to 54 years: 71.3% (#8 lowest)
- 55 to 64 years: 76.2% (#7 lowest)
- 65 years and over: 81.2% (#4 highest)
The housing market rebound continued into 2013—with increasing prices and home values across most markets. More buyers were able to enter the market thanks to the recovering economy and lower unemployment rates, but lending practices remained tight after the collapse a few years prior. It was still hard for buyers to get financing for home purchases, which kept the homeownership rate lower than it may have otherwise been. Still, the increase in home values helped many homeowners out of being underwater on their loans, and it allowed for more listings and sales of non-distressed properties.
MORTGAGE RATES TODAY
Interested in learning more about the current mortgage rates for your area? Learn more with Better Mortgage.
2014
- Homeownership rate (Q3): 64.4% (#5 lowest over past 25 years)
- Change from previous year: -0.9%
Regional breakdown:
- Northeast: 62.3% (#8 lowest over past 25 years)
- Midwest: 68.8% (#3 lowest)
- South: 65.7% (#5 lowest)
- West: 59.4% (#4 lowest)
Age breakdown:
- Under 35 years: 36% (#4 lowest over past 25 years)
- 35 to 44 years: 59.1% (#3 lowest)
- 45 to 54 years: 70.1% (#7 lowest)
- 55 to 64 years: 76.6% (#9 lowest)
- 65 years and over: 80% (#10 lowest)
By 2014, the housing market was on a full-blown upswing, with new home sales having the strongest performance since the market crash in 2008. Home values continued to increase as more home sales were completed, and while interest rates were higher than normal, more and more buyers were still helping to propel the market forward in its recovery. Lending parameters were still pretty tight during this time, but the stronger economy made it easier for buyers to obtain financing—which helped to keep the homeownership rate higher than it had been in previous years.
2015
- Homeownership rate (Q3): 63.7% (#2 lowest over past 25 years)
- Change from previous year: -0.7%
Regional breakdown:
- Northeast: 60.8% (#3 lowest over past 25 years)
- Midwest: 68.1% (#1 lowest)
- South: 65.4% (#3 lowest)
- West: 58.7% (#2 lowest)
Age breakdown:
- Under 35 years: 35.8% (#3 lowest over past 25 years)
- 35 to 44 years: 58.1% (#1 lowest)
- 45 to 54 years: 69.9% (#4 lowest)
- 55 to 64 years: 75.3% (#5 lowest)
- 65 years and over: 78.7% (#2 lowest)
As of 2015, the housing market was thriving, with buyer demand propelling the home prices—and buyer confidence—upward. This led to homeownership rates exploding, despite the uptick in home prices occurring nationwide. And, an ample supply of inventory from the events of the previous years kept more buyers flocking to the market—which was further fueled by interest rates being low across the board.

2016
- Homeownership rate (Q3): 63.5% (#1 lowest over past 25 years)
- Change from previous year: -0.2%
Regional breakdown:
- Northeast: 60.8% (#3 lowest over past 25 years)
- Midwest: 68.6% (#2 lowest)
- South: 65% (#1 lowest)
- West: 58.2% (#1 lowest)
Age breakdown:
- Under 35 years: 35.2% (#1 lowest over past 25 years)
- 35 to 44 years: 58.4% (#2 lowest)
- 45 to 54 years: 69.1% (#2 lowest)
- 55 to 64 years: 74.9% (#2 lowest)
- 65 years and over: 79% (#5 lowest)
Things got even better in 2016, with homeownership reaching a high note—especially in the South and West regions of the nation. The homeownership rate exploded during this time, with both new and existing home sales reaching record levels compared to 2006. One of the catalysts for the uptick in homebuying was low interest rates, which made it cheaper for borrowers to finance their home purchases—and lured tons of under-35 buyers to the market.
2017
- Homeownership rate (Q3): 63.9% (#3 lowest over past 25 years)
- Change from previous year: +0.4%
Regional breakdown:
- Northeast: 60.4% (#1 lowest over past 25 years)
- Midwest: 69.1% (#6 lowest)
- South: 65.5% (#4 lowest)
- West: 58.9% (#3 lowest)
Age breakdown:
- Under 35 years: 35.6% (#2 lowest over past 25 years)
- 35 to 44 years: 59.3% (#4 lowest)
- 45 to 54 years: 69.1% (#2 lowest)
- 55 to 64 years: 75% (#3 lowest)
- 65 years and over: 78.9% (#4 lowest)
As of 2017, homeownership rates had increased slightly compared to 2016—and it was an incredibly robust year for the housing market overall. Home values were higher than they’d been in years past, which could have otherwise deterred some buyers from entering the market—but the thriving economy and relatively low interest rates kept interest strong. Homes sold faster than ever during this year—especially in regions like the Northeast, where homeownership rates were up significantly.
2018
- Homeownership rate (Q3): 64.4% (#5 lowest over past 25 years)
- Change from previous year: +0.5%
Regional breakdown:
- Northeast: 61.5% (#4 lowest over past 25 years)
- Midwest: 69% (#5 lowest)
- South: 65.4% (#3 lowest)
- West: 60.2% (#9 lowest)
Age breakdown:
- Under 35 years: 36.8% (#7 lowest over past 25 years)
- 35 to 44 years: 59.5% (#5 lowest)
- 45 to 54 years: 69.7% (#3 lowest)
- 55 to 64 years: 75.6% (#6 lowest)
- 65 years and over: 78.6% (#1 lowest)
The homeownership rates continued to climb year-over-year as of 2018, with more homeowners entering the market to capitalize on increasing values and stable growth across the nation. Surprisingly, this occurred despite an uptick in mortgage rates, which made borrowing more expensive for home buyers. The strong economy was likely one of the catalysts for this growth, as buyers were better able to afford to borrow money for their home purchases. The opportunity to build housing wealth via the housing boom added to the allure, and this drove at least part of the increase in homeownership at this time.
THINKING ABOUT REFINANCING?
Curious about refinancing but not sure where to start? Use the Better Mortgage refinance calculator to consider all your options.
2019
- Homeownership rate (Q3): 64.8% (#6 lowest over past 25 years)
- Change from previous year: +0.4%
Regional breakdown:
- Northeast: 61.7% (#6 lowest over past 25 years)
- Midwest: 69% (#5 lowest)
- South: 66.2% (#6 lowest)\
- West: 60.6% (#10 lowest)
Age breakdown:
- Under 35 years: 37.5% (#8 lowest over past 25 years)
- 35 to 44 years: 60.3% (#6 lowest)
- 45 to 54 years: 70.1% (#7 lowest)
- 55 to 64 years: 75.1% (#4 lowest)
- 65 years and over: 78.9% (#4 lowest)
By 2019, the housing market was close to its strongest point ever—which led to high amounts of confidence and even more buyers entering the market. The real estate market seemed like a sure bet, and interest rates were lower than the previous year, meaning that buyers could borrow money at a cheaper cost while building wealth. Most metro areas were seeing substantial upticks in home values, too—which meant that buyers who opted into the market were all but guaranteed to gain equity with their home purchases.
2020
- Homeownership rate (Q3): 67.4% (#11 highest over past 25 years)
- Change from previous year: +2.6%
Regional breakdown:
- Northeast: 62% (#7 lowest over past 25 years)
- Midwest: 71.2% (#13 lowest)
- South: 70.8% (#2 highest)
- West: 62.1% (#11 highest)
Age breakdown:
- Under 35 years: 40.2% (#10 highest over past 25 years)
- 35 to 44 years: 63.9% (#11 lowest)
- 45 to 54 years: 72% (#10 lowest)
- 55 to 64 years: 76.4% (#8 lowest)
- 65 years and over: 80.7% (#8 highest)
High unemployment rates and other financial hurdles caused by the coronavirus pandemic could have caused huge issues with the housing market, but that’s the opposite of what happened. Homeownership rates actually soared at the start of the pandemic, due in large part to a massive decline in interest rates. The Fed’s decision to drop the cost of borrowing made buying a home cheaper than it ever had been, even as home prices and values soared. New buyers clambered to take advantage of the historically low interest rates, causing home inventory shortages and cutthroat buyer competition—and led to a shockingly high uptick in homeownership rates.
2021
- Homeownership rate (Q3): 65.4% (#8 lowest over past 25 years)
- Change from previous year: -2%
Regional breakdown:
- Northeast: 61.7% (#6 lowest over past 25 years)
- Midwest: 70.9% (#11 lowest)
- South: 67% (#9 lowest)
- West: 59.9% (#7 lowest)
Age breakdown:
- Under 35 years: 38.5% (#10 lowest over past 25 years)
- 35 to 44 years: 61.3% (#8 lowest)
- 45 to 54 years: 70.1% (#7 lowest)
- 55 to 64 years: 73.7% (#1 lowest)
- 65 years and over: 79.7% (#8 lowest)
Homeownership rates actually declined from 2020 to 2021, despite mortgage rates staying near historical lows and inventory demand staying near all-time highs. This decline in homeownership is almost certainly due to buyers being priced out of the market as investors and other flush-with-cash buyers snatch up properties at record rates. The rampant competition for the limited housing inventory has made it tough for new buyers to compete for housing purchases. And that, rather than a downturn in buyer interest, is likely the main factor at play in the decline in homeownership compared to 2020.
In 2022, housing experts project mortage rates to rise slightly from record-breaking lows in the years prior. Home prices are expected to grow, but not as rapidly as they did in 2021.
SEARCHING FOR A HOME?
Make your offer 4x more competitive with Better's Cash Offer Program. To learn more, click below or call us at 415-523-8837.